In the fast-paced digital landscape of the 21st century, data has become the lifeblood of organizations across all sectors. Every click, purchase, and interaction generates a wealth of information, but the challenge lies in making sense of this vast sea of data. This is where data visualization emerges as a beacon of clarity in the murky waters of data overload. Data visualization is not merely about creating pretty pictures; it’s about transforming raw data into actionable insights through the power of visual representation.
Data visualization encompasses a broad spectrum of techniques, ranging from simple charts and graphs to complex interactive dashboards. At its core, data visualization is the art of presenting data in a visually appealing and comprehensible format, allowing users to explore, analyze, and interpret data with ease. By leveraging the innate human ability to process visual information rapidly, data visualization enables organizations to unlock the untapped potential of their data, driving innovation, efficiency, and informed decision-making.
However, data visualization is not a one-size-fits-all solution. It requires a nuanced understanding of the data being visualized, the audience it is intended for, and the objectives of the analysis. From choosing the right visualization technique to designing an intuitive user interface, every aspect of data visualization demands careful consideration and expertise. In this comprehensive guide, we will delve deep into the world of data visualization, exploring its various techniques, applications, and benefits, and equipping you with the knowledge and tools to harness the power of data visualization effectively.

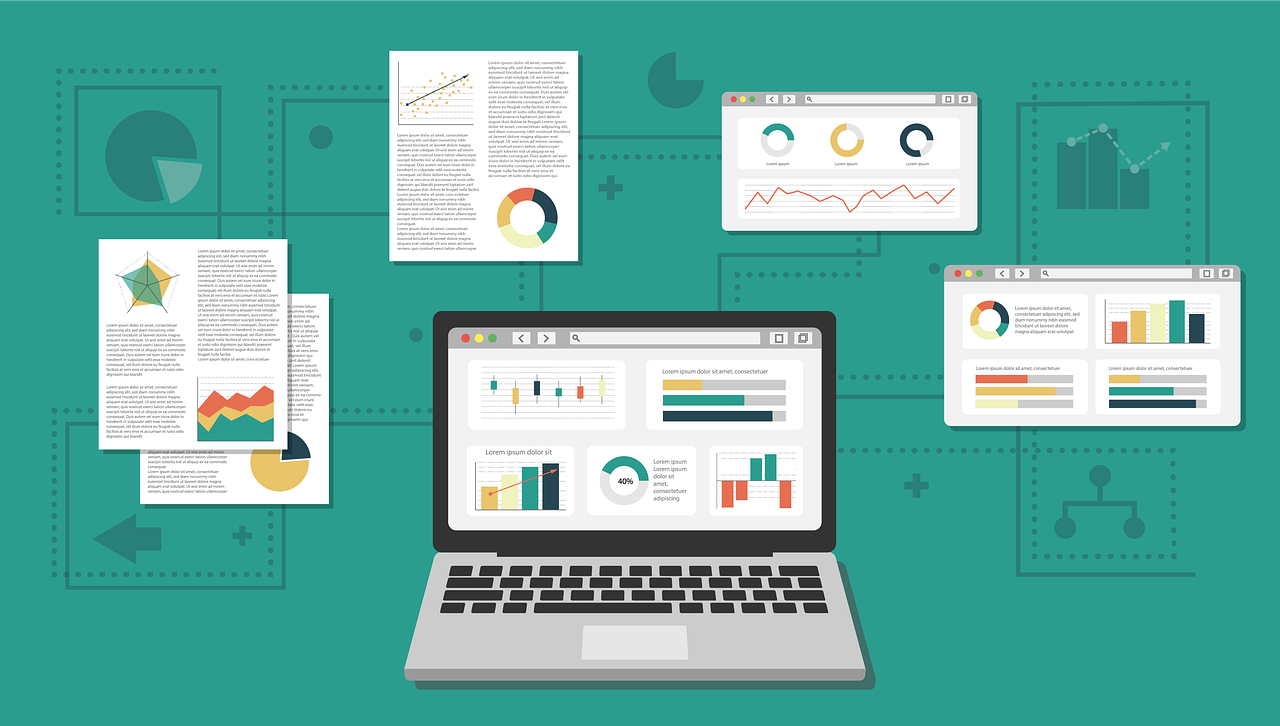
Representative image of data visualization - Source : pixabay.com
Understanding Data Visualization
Data visualization is more than just a means of presenting data visually; it is a powerful tool for uncovering insights, identifying patterns, and communicating complex information effectively. By transforming raw data into visual representations such as charts, graphs, and maps, data visualization enables users to discern trends, relationships, and anomalies that may not be apparent in tabular data. Whether it’s analyzing sales trends, tracking customer behavior, or visualizing geographic data, data visualization provides a visual context that enhances understanding and facilitates decision-making.
Effective data visualization involves a combination of art and science. It requires an understanding of data visualization principles, such as visual encoding, color theory, and gestalt principles, as well as proficiency in tools and technologies such as Tableau, Power BI, and Python libraries like Matplotlib and Seaborn. Moreover, data visualization requires a deep understanding of the data being visualized, including its structure, context, and underlying patterns. By mastering the fundamentals of data visualization, you can create visualizations that are not only aesthetically pleasing but also insightful and impactful.
Importance of Data Visualization
The importance of data visualization cannot be overstated in today’s data-driven world. In an era where data is generated at an unprecedented rate, organizations face the daunting task of making sense of this deluge of information. Data visualization offers a solution to this challenge by providing a visual framework for understanding and interpreting data effectively. By presenting data in a visual format, organizations can distill complex information into digestible insights, enabling stakeholders to make informed decisions quickly and confidently.
Data visualization is particularly valuable in domains such as business intelligence, where organizations rely on data-driven insights to drive strategy, optimize operations, and gain a competitive edge. From sales forecasting to marketing analytics, data visualization plays a central role in every aspect of the decision-making process, enabling organizations to identify trends, spot opportunities, and mitigate risks effectively. Moreover, data visualization enhances communication by providing a common language for sharing insights and findings across teams and departments, fostering collaboration and alignment.
In addition to its applications in business, data visualization is also instrumental in fields such as scientific research, healthcare, and public policy. In scientific research, for example, data visualization enables researchers to visualize experimental results, analyze complex datasets, and communicate their findings to the broader scientific community effectively. Similarly, in healthcare, data visualization facilitates the analysis of patient data, the tracking of disease outbreaks, and the monitoring of public health trends, enabling healthcare providers and policymakers to make data-driven decisions that save lives and improve outcomes.
Types of Data Visualization
Data visualization encompasses a diverse array of techniques and tools, each tailored to different types of data and analytical objectives. Some common types of data visualization include:
- Charts and Graphs
- Maps
- Infographics
- Dashboards
Charts and Graphs
Line charts, bar graphs, pie charts, and scatter plots are among the most widely used types of data visualization for representing numerical data and comparing variables. Line charts are ideal for visualizing trends over time, while bar graphs are effective for comparing discrete categories. Pie charts are useful for illustrating proportions, and scatter plots are valuable for exploring relationships between variables.
Maps
Geographic data can be visualized using maps, allowing users to visualize spatial patterns, distributions, and relationships. From choropleth maps that display data by region to point maps that pinpoint specific locations, maps provide a powerful tool for analyzing geographic data and identifying spatial trends.
Infographics
Infographics combine text, images, and visual elements to convey complex information in a visually engaging and easy-to-understand format. By presenting data in a narrative format, infographics enable users to grasp key insights quickly and intuitively, making them ideal for presentations, reports, and marketing materials.
Dashboards
Dashboards provide a comprehensive overview of key metrics and performance indicators, allowing users to monitor trends, track progress, and make data-driven decisions in real-time. By consolidating multiple visualizations into a single interface, dashboards enable users to gain a holistic view of their data and take action accordingly.
Benefits of Data Visualization
The benefits of data visualization are manifold and extend across various domains and disciplines. Some key benefits include:
Enhanced Understanding
Visual representations make it easier for individuals to comprehend complex data and extract meaningful insights, leading to deeper understanding and more informed decision-making.
Improved Decision-Making
Data visualization enables users to identify trends, patterns, and outliers in data more effectively, empowering them to make timely and informed decisions that drive business success.
Increased Efficiency
Visualizing data allows users to analyze large datasets quickly and efficiently, saving time and resources compared to manual data analysis methods. By automating repetitive tasks and streamlining workflows, data visualization enhances productivity and accelerates decision-making processes.
Enhanced Communication
Visualizations facilitate clearer and more effective communication of data-driven insights to stakeholders, fostering collaboration and alignment across teams. By presenting data in a visually appealing and intuitive format, visualizations enable users to convey complex information in a way that is easy to understand and interpret.
Greater Engagement
Visualizations are inherently engaging and can capture the attention of viewers more effectively than plain text or numerical data. By leveraging visual elements such as colors, shapes, and patterns, visualizations create an immersive experience that stimulates curiosity and encourages exploration, leading to greater engagement and retention of information.

Representative image of data visualization - Source : pixabay.com
How Data Visualization is Helpful?
Data visualization offers a multitude of benefits across various industries and disciplines, making it an indispensable tool for decision-making, problem-solving, and communication. Here are four key ways in which data visualization proves to be helpful:
Uncovering Insights
One of the primary benefits of data visualization is its ability to uncover insights hidden within complex datasets. By transforming raw data into visual representations such as charts, graphs, and maps, data visualization allows users to identify patterns, trends, and relationships that may not be immediately apparent in tabular data. Whether it’s spotting anomalies in sales data, detecting correlations between variables, or visualizing geographic trends, data visualization enables users to extract actionable insights that drive informed decision-making.
Enhancing Decision-Making
In today’s fast-paced business environment, making timely and informed decisions is critical for success. Data visualization empowers decision-makers to navigate through vast amounts of data efficiently and effectively, enabling them to identify opportunities, mitigate risks, and optimize outcomes. By providing a visual context for data analysis, data visualization enables decision-makers to gain a deeper understanding of the factors influencing their decisions, leading to more confident and impactful choices.
Improving Communication
Data visualization serves as a universal language for communicating complex information in a clear and concise manner. Whether it’s presenting financial performance metrics to stakeholders, visualizing survey results for a client presentation, or illustrating public health trends for policymakers, data visualization facilitates communication by making data accessible and understandable to a wide range of audiences. By creating visually compelling and intuitive visualizations, data visualization fosters engagement, promotes comprehension, and enhances the effectiveness of communication efforts.
Driving Innovation
Data visualization fuels innovation by enabling organizations to explore new ideas, test hypotheses, and uncover opportunities for improvement. By visualizing data in innovative ways, organizations can gain fresh perspectives, challenge assumptions, and identify novel solutions to complex problems. Whether it’s visualizing customer journey maps to improve user experience or analyzing social media data to identify emerging trends, data visualization inspires creativity, stimulates curiosity, and fuels innovation across all levels of an organization.
In essence, data visualization serves as a dynamic catalyst in the modern landscape of information analysis, providing a multitude of invaluable benefits that propel organizations and individuals forward. Firstly, it facilitates the process of uncovering insights buried within vast and intricate datasets. By transforming raw data into visually stimulating representations such as charts, graphs, and interactive dashboards, data visualization enables users to discern patterns, trends, and correlations that might otherwise remain concealed. This ability to extract actionable insights empowers decision-makers to make informed choices, optimize strategies, and seize opportunities with confidence.
Moreover, data visualization plays a pivotal role in enhancing decision-making processes across various domains. By presenting complex information in a visual format, it simplifies the understanding of key metrics and performance indicators, allowing stakeholders to grasp critical insights at a glance. This clarity and accessibility enable decision-makers to navigate through data complexities more efficiently, leading to quicker and more informed decisions that drive organizational success.
Furthermore, data visualization serves as a potent tool for improving communication and fostering collaboration among diverse stakeholders. Visual representations of data have an innate ability to transcend language barriers and convey complex concepts in a universally understandable manner. Whether it’s presenting financial reports to investors, illustrating market trends to clients, or visualizing public health data for policymakers, data visualization facilitates clear and concise communication, thereby promoting alignment, engagement, and informed dialogue.
Lastly, data visualization fuels innovation by enabling organizations and individuals to explore new ideas, test hypotheses, and uncover novel insights. By visualizing data in innovative and creative ways, users can gain fresh perspectives, challenge existing paradigms, and identify untapped opportunities for growth and improvement. This spirit of exploration and experimentation fosters a culture of innovation within organizations, driving continuous improvement and adaptation to changing market dynamics.
In summary, data visualization serves as a cornerstone of success in today’s data-driven world, offering a powerful toolkit for unlocking insights, enhancing decision-making, improving communication, and driving innovation. Whether you’re a business leader navigating market complexities, a researcher unraveling scientific mysteries, or a policymaker shaping public discourse, mastering the art of data visualization is indispensable for achieving meaningful outcomes and driving positive change.

 10 Open Data Sources to Fuel Your Data-Driven Insights